Customers win. Techs win. TELUS wins.
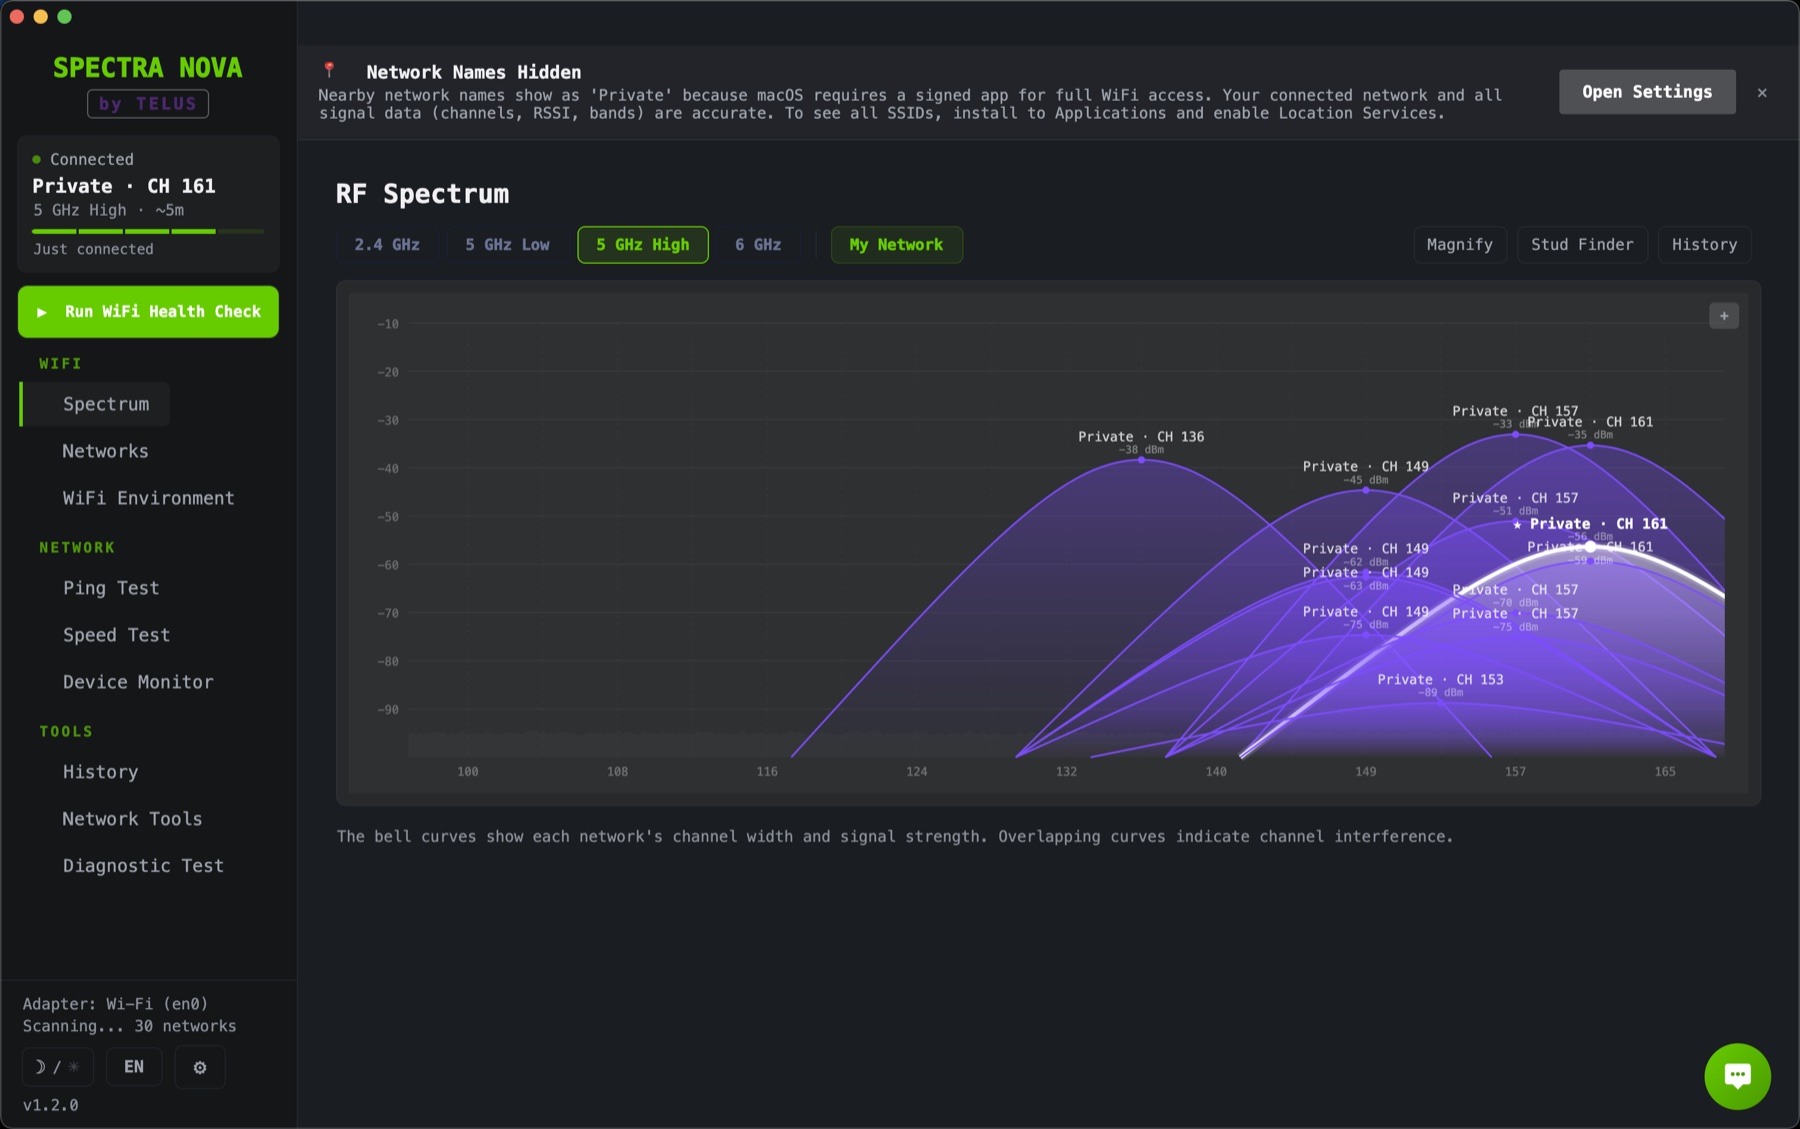
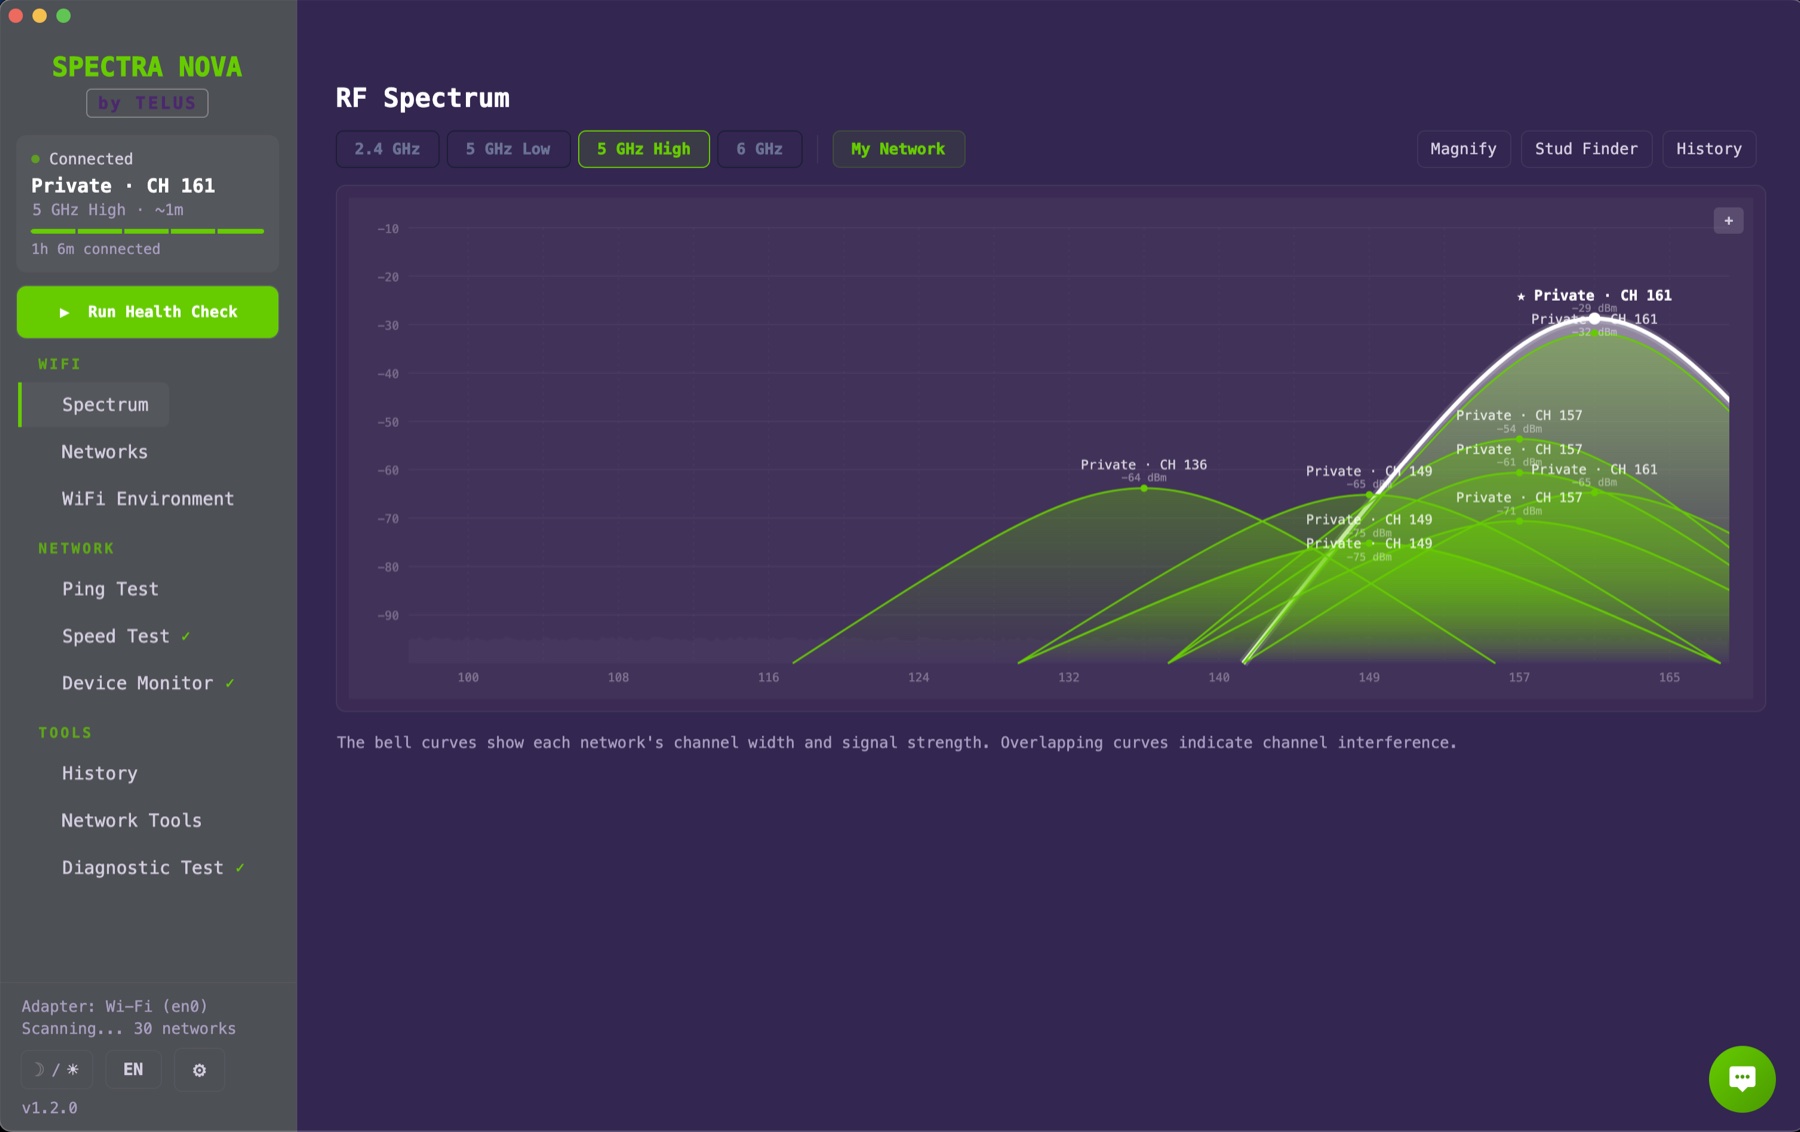
Live RF spectrum across every band · supports light + dark themes
A residential WiFi complaint resolves to one of five things:
No tech has a single tool that reads all five in under five minutes. They improvise with netsh, ipconfig, consumer apps, and tribal knowledge, then leave with a guess.
In under five minutes, the tech sees: signal at every room, channel congestion on every band, real download and upload speeds, bufferbloat under load, every device on the subnet. All of it distilled into a single 0–100 WiFi Health score with a customer-facing branded HTML report. One screen. Ten panels. Zero modem-GUI dance.
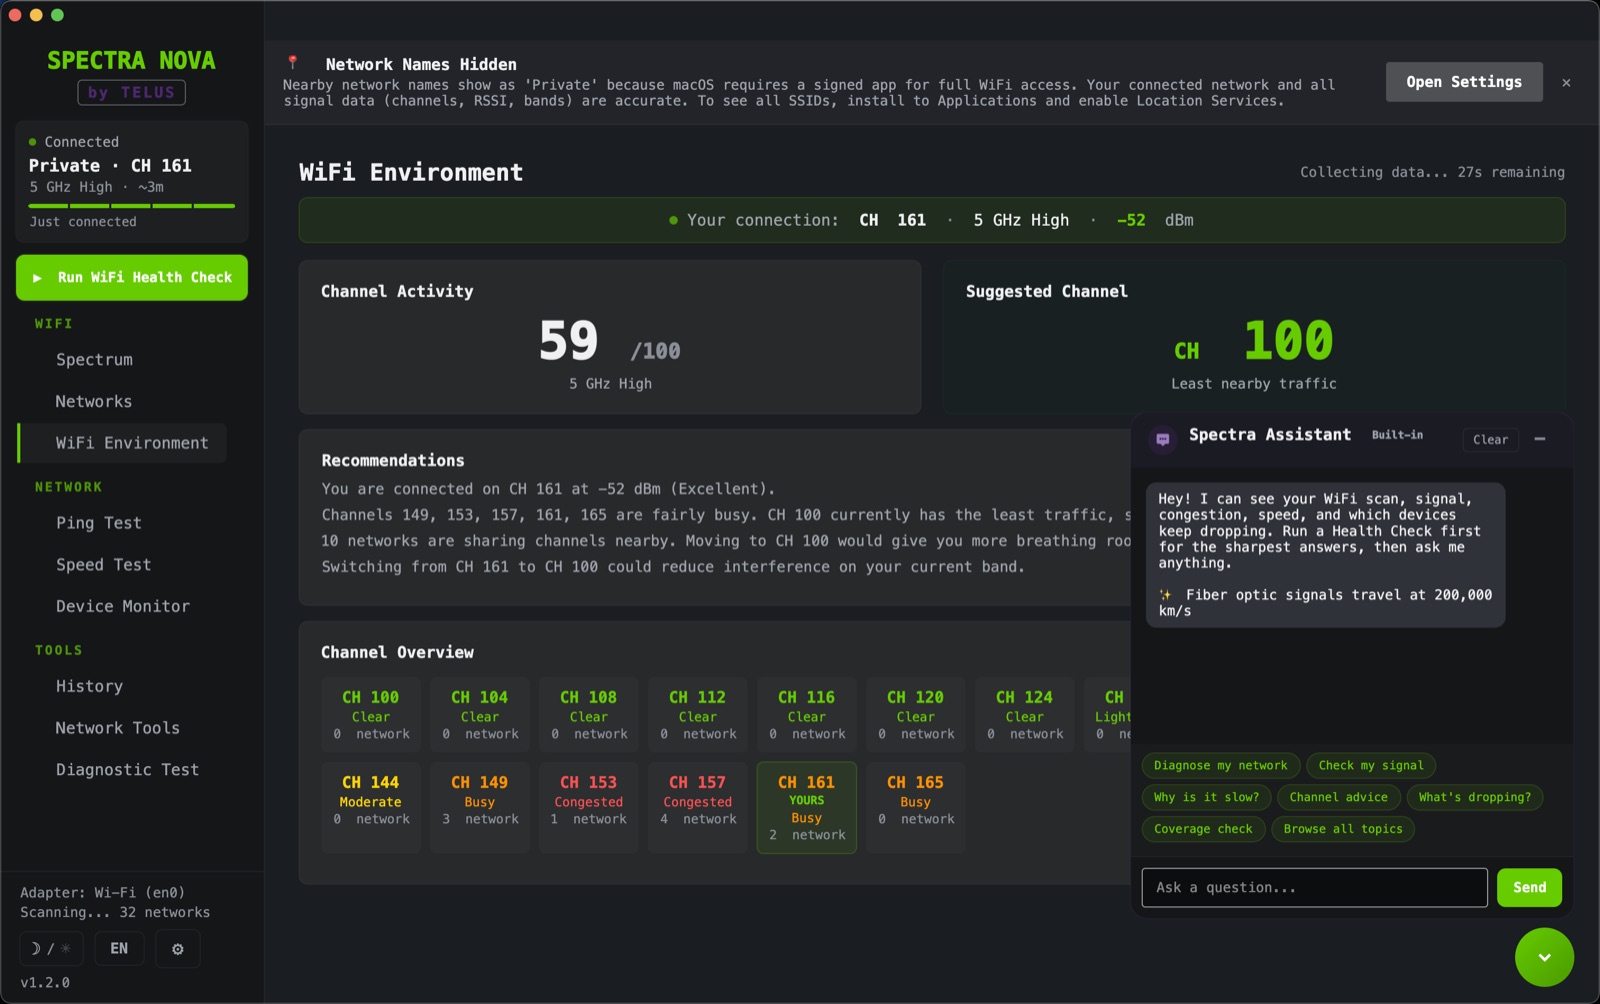
An assistant that reads the live network. When a tech asks "why is it slow?", the bot pulls the current RSSI, the channel congestion percentage, the last speed-test result, and the dropped-device history, then answers with those exact numbers cited inline. The numbers it cites are the ones reading off the radio at the moment the question is asked. Backed by 338 curated TELUS-specific KB entries across 16 categories. Zero hallucination on matched queries, verified against a 540-cell regression matrix on every change.
100% offline by default. Audited 8-endpoint allowlist. Passes a privacy review in one meeting.
Owned, not rented. Source, KB, and CI pipeline transfer with the license. No SaaS dependency. No surprise data residency. No third-party telemetry.
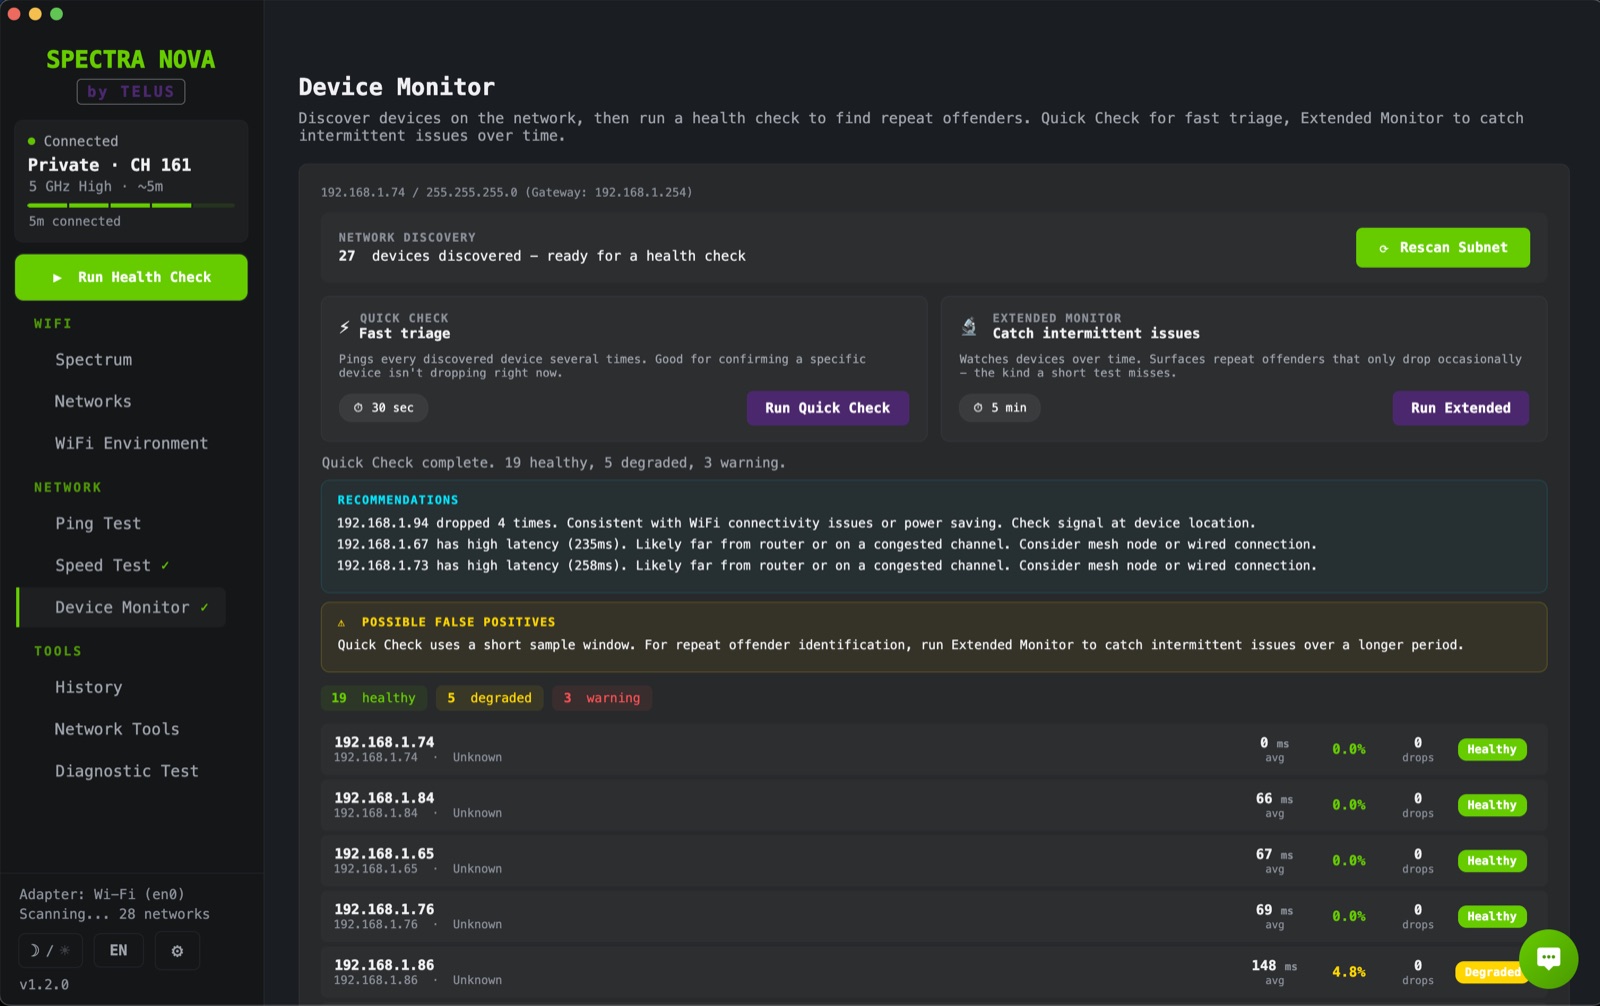
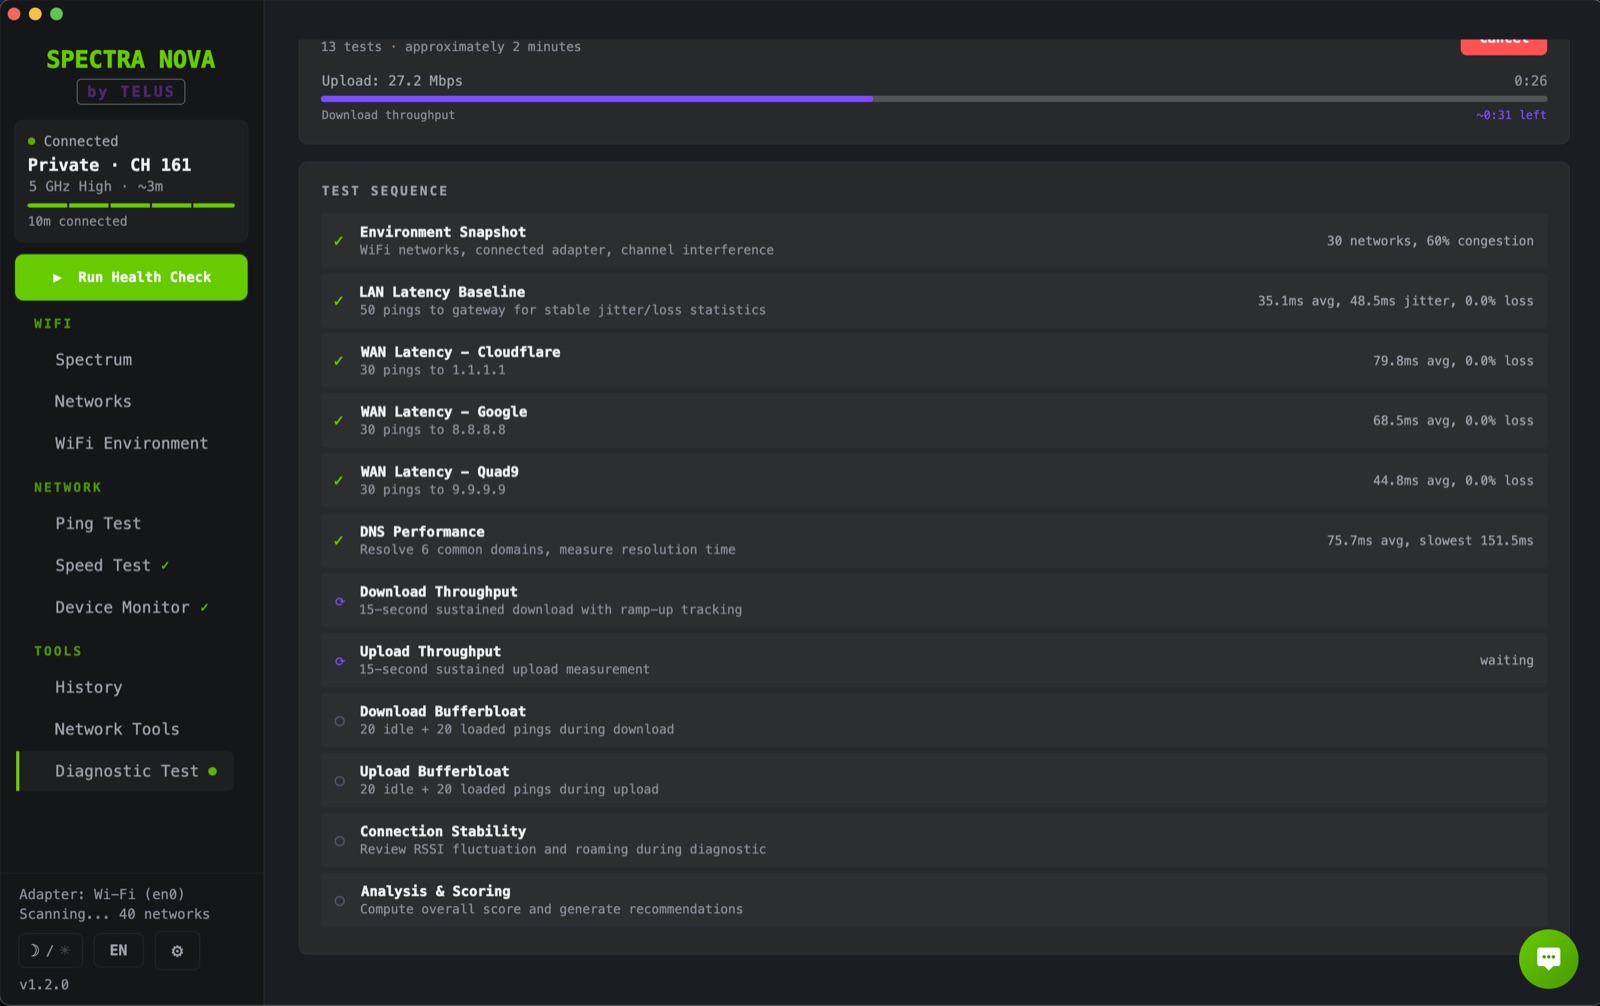
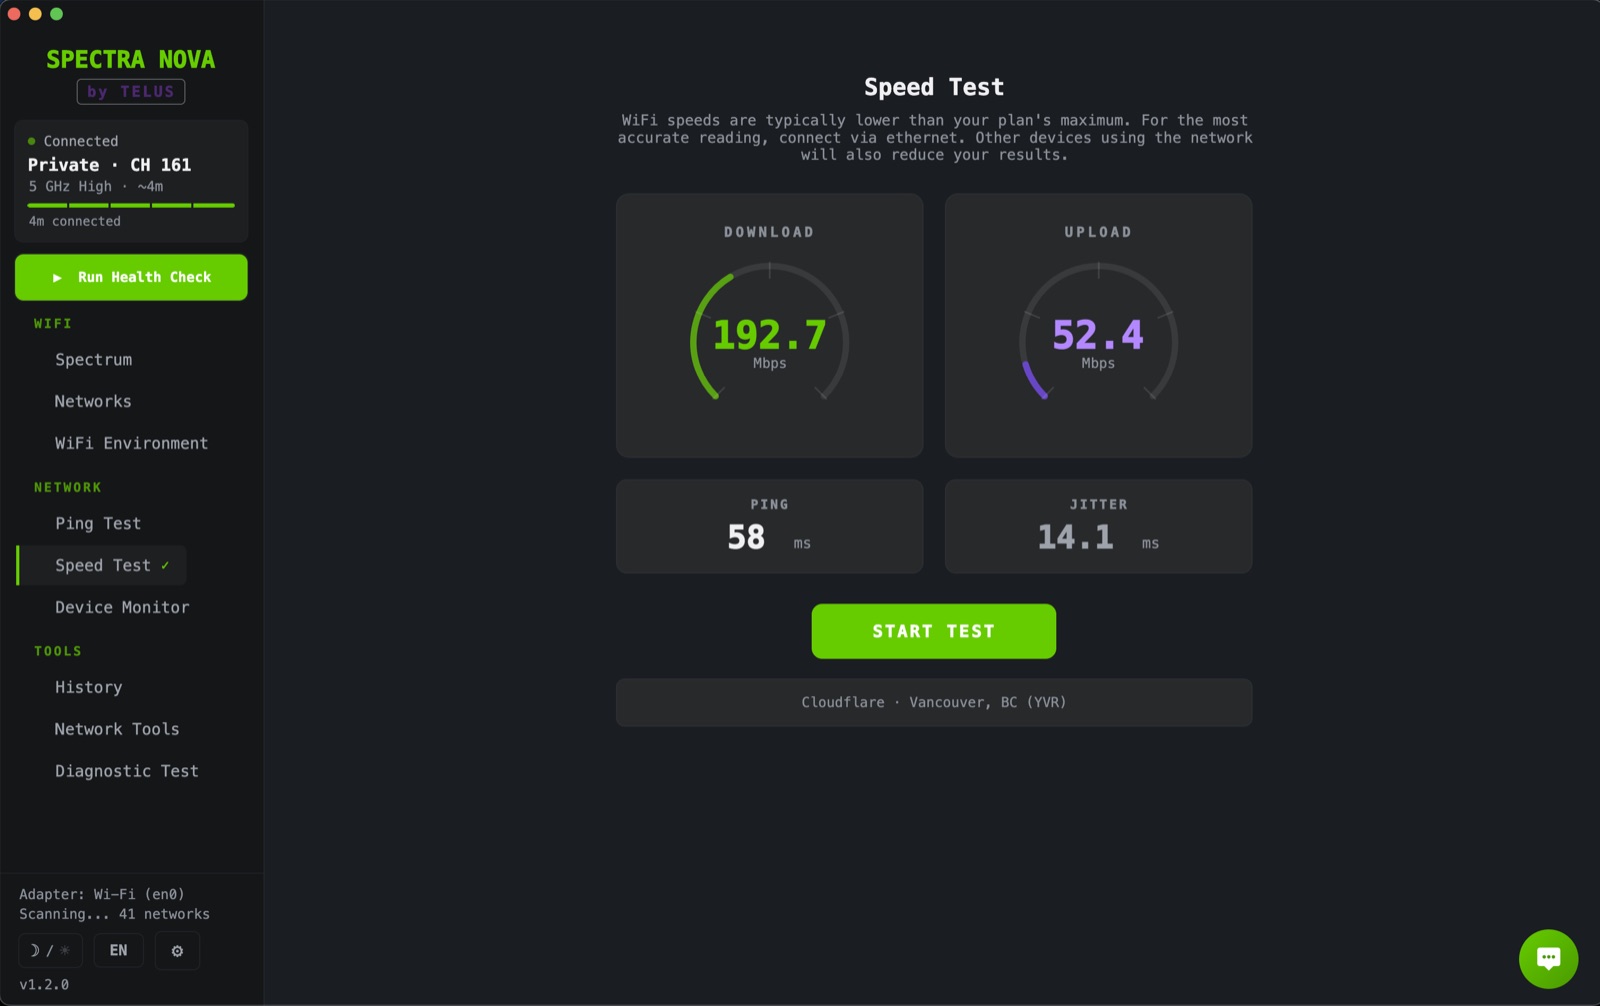
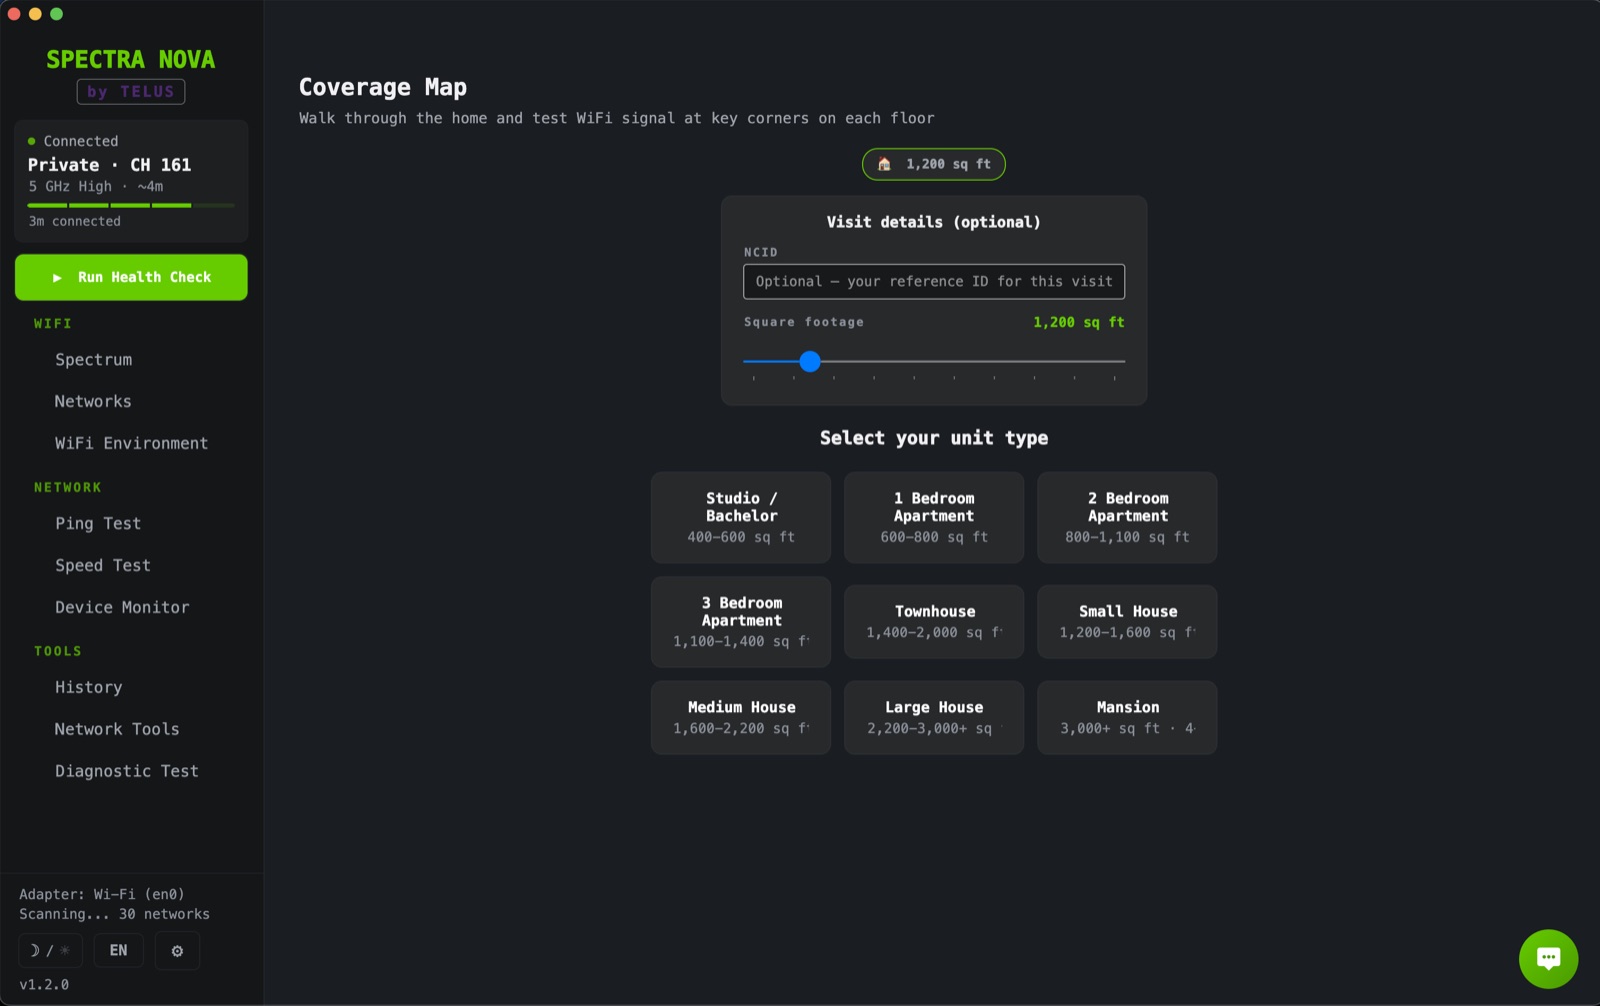
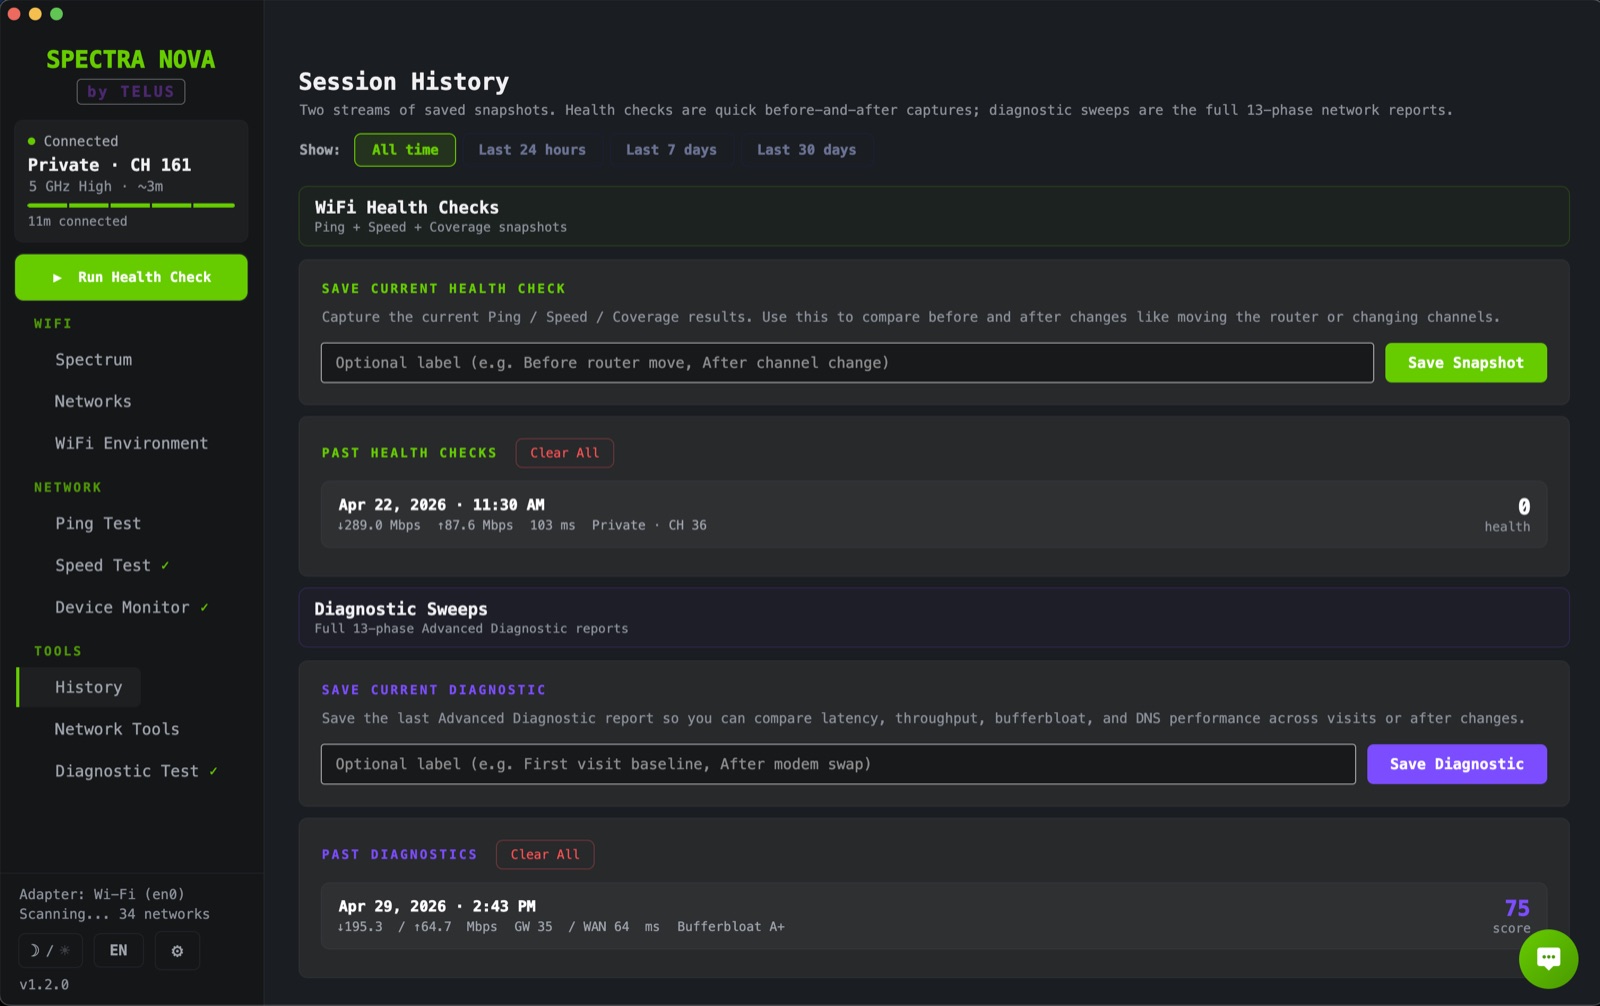
Six panels, six different angles on the same diagnostic moment. Click any tile to open it full-size.
A scripted demo of the Spectra Nova chat panel. Sample network context shown at top; tap a question below to see how the bot grounds its answer in those exact numbers.
The same diagnostic moment changes everyone's day.
Tuesday afternoon. The customer has called three times this month about the same disconnect. The tech opens Spectra Nova, runs the Health Check, and walks out twenty minutes later with a printed report explaining exactly what was changed and why. The customer doesn't call back.
Estimate, not forecast. We don't have your operations data. Here's the model, anchored where possible in TELUS public reporting and industry benchmarks.
N
Your field tech count
~25.2K TELUS employees
T
Truck rolls per tech per month
industry: 20–40
R
Current repeat-visit rate
industry: 15–25%
X
Repeat-visit reduction Spectra Nova delivers
the pilot measures this
$250
Truck-roll cost
industry $150–$600
X turns out to be, plug it back in. The answer is yours.
Spectra Nova is instrumented end-to-end for the measurement. Every query and diagnostic is logged, ready for the post-pilot review.
LLMs hallucinate device specs, plan tiers, signal thresholds. Spectra Nova can't. Its curated KB and structured analyzers cite numbers; they never invent them.
The Anthropic API integration is already wired. Paste an API key and Claude takes over as the assistant. The same live network context flows through: RSSI, congestion, speed, device history. Sensitive details masked on the way out. Rate-limited. Audit-logged. Off by default, per-tech opt-in.
For TELUS, that's two deployment paths shipping today: standalone (curated KB, fully offline, zero cloud) or Claude-augmented (frontier reasoning, customer data masked). One install, one license, one fleet. Your techs choose.
What ships today is the field tool described above. As TELUS opens access, three integrations deepen the value without changing the architecture or the surface area.
With a lightweight firmware agent on the modem, Spectra Nova streams live diagnostics straight into the field tool: CPU temperature, modulation profile, line attenuation, SNR margin, error counters. "Walk in, plug in, locate, solve." Many visits resolve before the tech finishes setup.
With access to TELUS provisioning, ONT health, account flags, neighborhood-outage signals, and modem fleet inventory, the assistant retrains on TELUS-specific data and handles line-level issues the customer side can't reveal: account provisioning gaps, plan-tier mismatches, regional ISP-side outages, ONT silent-fail patterns. The tech walks in already knowing whether the issue is local or upstream.
WiFi diagnostic with curated KB. Tech sees what's in the room. Bot answers from grounded readings. Zero hallucination, fully offline. Pilot-ready today.
Built solo. Independent. Ready to license. Architecture and methodology available on request.
I'm Kevin Madson. Eight years as a field technician before this.
Every analyzer, every KB entry, every "why does this break this way" assumption in Spectra Nova traces back to a real customer visit. A real escalation chain. A real "I knew it, but I couldn't prove it" moment.
Built by a tech, for techs.
The bot doesn't know what it's like to walk into a customer's house at 4 PM on a Friday. The person who built it does.
Four weeks. One truck crew. A control group. Measure first-time-fix rate and truck-roll time against the control. Decide from the data.
Email below. Happy to walk through the architecture, the regression matrix, or the integration roadmap in thirty minutes.
Start the conversation →